NEXUS iQ — LIVE ANALYTICS

Real-time data at your fingertips.

Live HVAC Analytics Dashboard

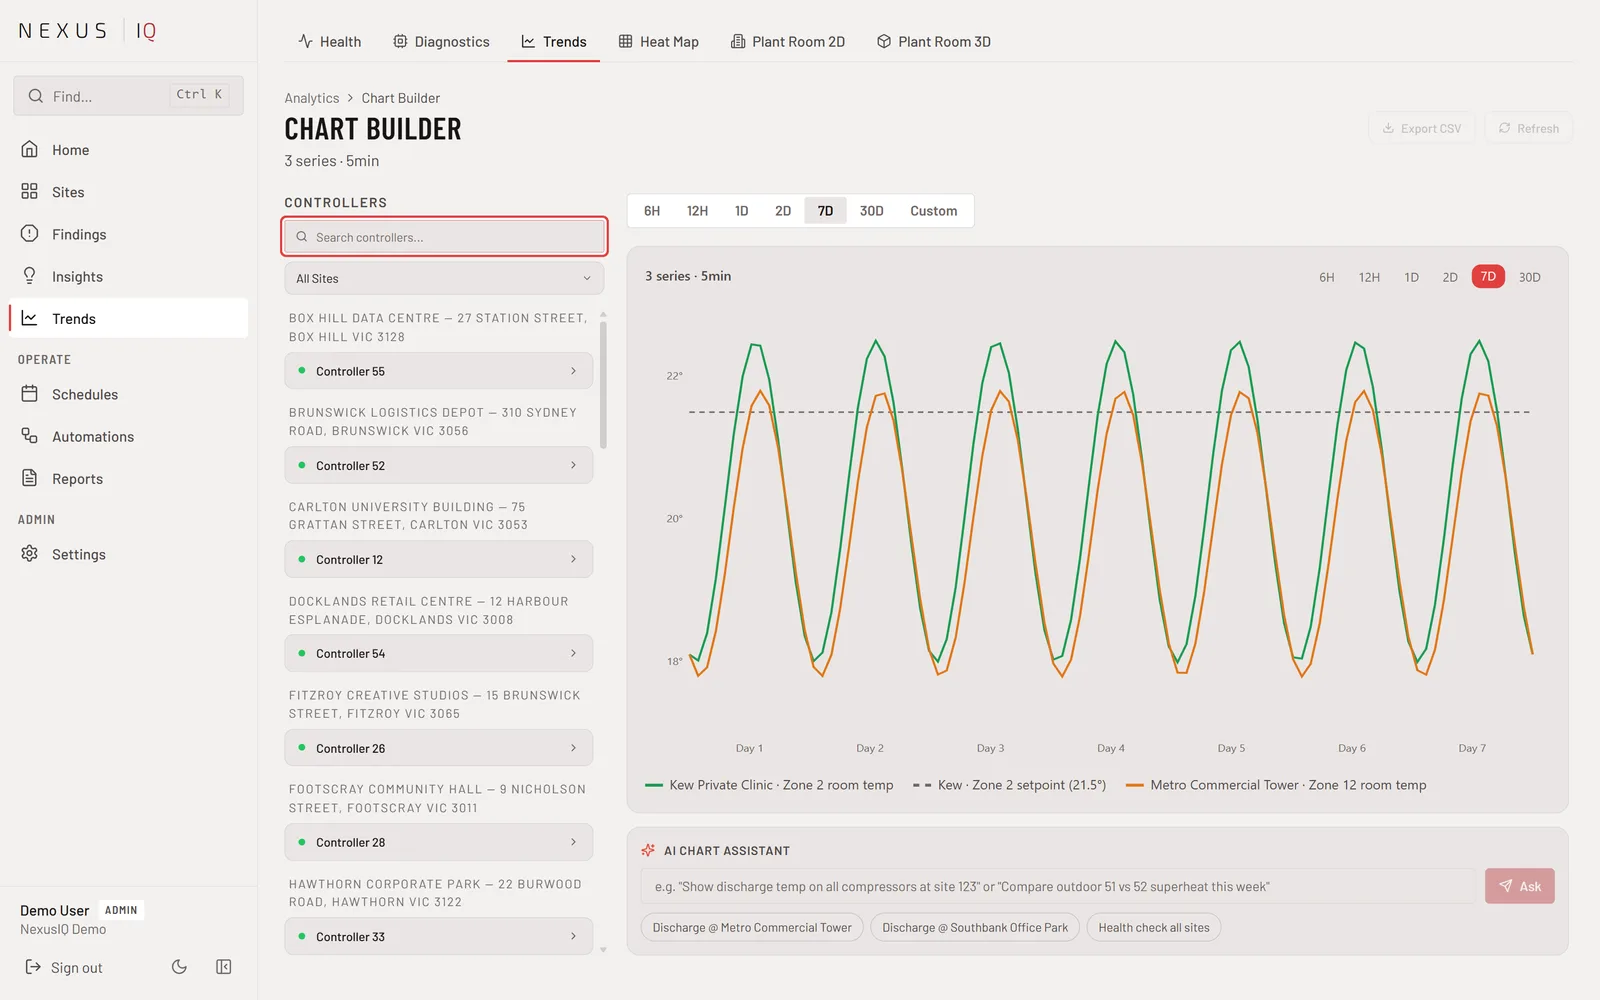
Monitor compressor frequency, discharge temperature, evaporator readings and ambient conditions — all updating live across every unit on site.

LIVE DATA STREAMS

8+ parameters. One screen.

Nexus iQ™ captures live operating data from every connected unit and displays it in a multi-series analytics chart. Track trends, spot anomalies, and make informed decisions instantly.

Multi-series charting — Monitor compressor Hz, discharge temp, evaporator readings, and ambient conditions simultaneously

Interactive zoom — Click and drag on any time range to inspect system behaviour down to the minute

Flexible time windows — Switch between 6H, 12H, 1D, 7D, and 30D views to see short-term events or long-term trends

Colour-coded data series — Each parameter has its own colour for instant visual identification

Live Analytics Dashboard
8+
DATA SERIES
30D
HISTORY DEPTH
100ms
UPDATE SPEED
24/7
MONITORING
Related Features

Explore the Nexus iQ platform

Want to see live analytics in action?

Book a free demo and experience Nexus iQ for yourself.

Get in Touch