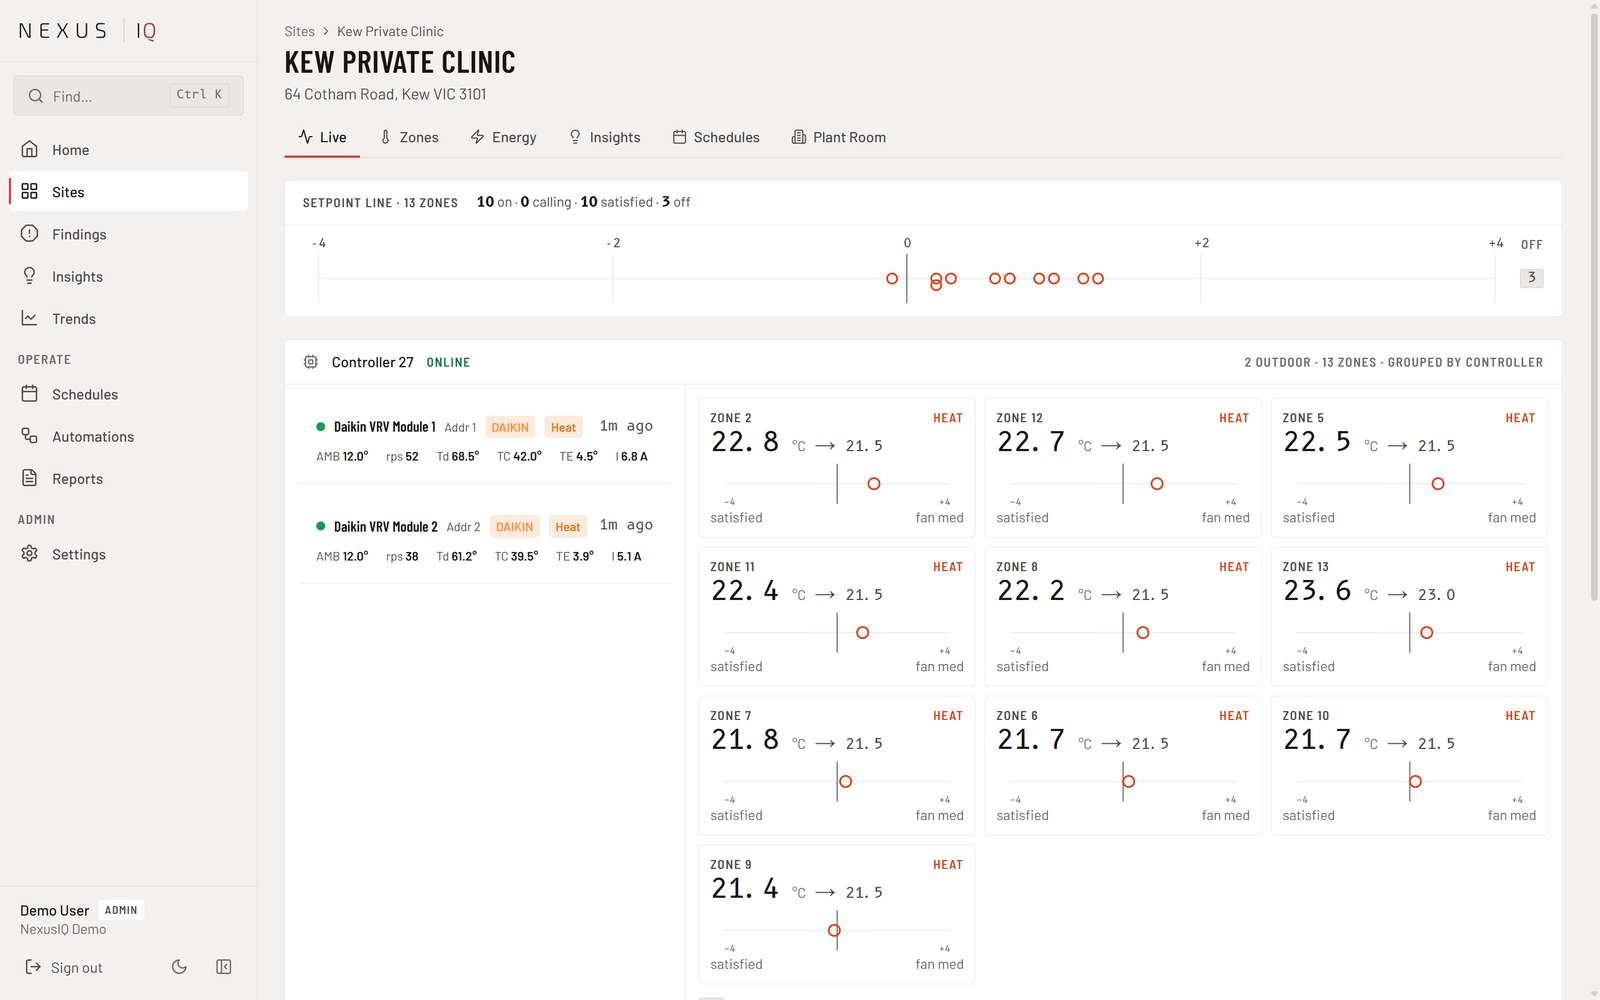
Nexus iQ™ is the cloud platform every Nexus controller reports to. It shows live readings from every indoor and outdoor unit on the network, tells you what is wrong in plain English, and lets you switch, schedule and report from a browser or the AirNexus app.
Everything in it is counted from what the units report, polled every 30 seconds. Where a unit does not report a value, Nexus iQ leaves it blank rather than filling it in, and where a number cannot be defended it says so.
Built for building managers, HVAC contractors and automation integrators, one site or a whole portfolio, on web, iOS and Android.
Key Features
Live readings from every unit: room temperature, setpoint, mode and fan for every indoor unit; ambient, compressor frequency, discharge, condensing and suction temperatures, pressures, expansion valve and power for every outdoor unit
Findings: what needs a person, as a sentence: what was seen, how long it has been active and what it is consistent with
Insights: how the estate behaves, counted from telemetry: zone runtime, time to temperature, out-of-hours running, compressor starts
System Health: an engineering health score for every indoor and outdoor unit over 24 hours, 7 days or 30 days
Live Diagnostics: raw telemetry straight off the bus, and a refrigerant circuit map drawn from live readings
Trends: a chart builder for any reading on any unit, 6 hours to 30 days, CSV export and an AI chart assistant
Heat Map: every zone in the fleet coloured by how far it is from setpoint
Control: set temperature and mode per zone or for a whole site, run per-site or global schedules, and write automation rules on sensor readings
Reports: PDF reports with up to 14 sections, one site or two sites compared, with an AI wizard
Multi-site: sites sorted worst first, a fleet-wide Setpoint Line, a map, and comfort rankings across the portfolio
Specifications
Access
Web browser, iOS app, Android app
Data
Polled from the units every 30 seconds
Sites
Multi-site, one login
Users
Admin and user roles per account
History
Chart windows from 6 hours to 30 days, or a custom range
Reports
PDF on demand, 1, 6 or 12 month periods, up to 14 sections
Control
Zone setpoint and mode, schedules, automation rules
See it on your building.
Book a free demo. We show you your sites, not a slide deck.